Programs
Curve Fitting
Fitting Tutorial
Introspection
Save Files
Array/Set
Printing
Graphics
Mathematics
Ephemeris/Timing
Input/Output
Miscellaneous
Full Listing
Documentation
Craig's techie blog.
| IDL Graphics Programs | ||||||||||||||||||||||||||||||||||||||||||||
|
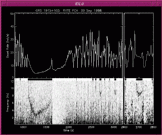
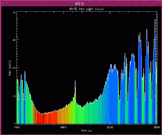
These programs use a "PANEL" package, which is included within the program code. Aside from the files listed, no extra downloads are needed. Please let me know if you have problems. I am still updating these programs as needed. All of the plotting programs should behave correctly if you give either the standard POSITION keyword or no positioning information at all. They also accept an arcane "PANEL/SUBPANEL" notation which you should not worry about unless you want to. PLOTCUBE is a whimsical demonstration of PANELs -- an example of how to create a tight matrix of plots. You can download the entire plotting archive here:
PLOTIMAGE - Display an image using a PLOT-like interface
PLOTIMAGE in particular makes it very easy to plot images or slices of images with proper coordinate axes. Once this is done, then overlays of other graphics like contours is very easy, since the coordinate system is already established. Display of images is essentially achieved in the same way that other data is plotted with PLOT. You can specify an XRANGE and YRANGE to include or exclude any part of the image, etc. OPLOTIMAGE will overlay an image on an existing plot, not necessarily created by PLOTIMAGE. This new version (19 Apr 2000) has significant improvements. Display of true-color 8 and 24 bit images should work in both 8 and 24 graphics modes. By default the screen image is not smoothed; activate smoothing with the /INTERP keyword. Printed images can be automatically smoothed to achieve a minimum desired pixel resolution via the MIN_DPI keyword. Automatic intensity scaling of 8 bit images can be done via the RANGE keyword and its attendant color table selection keywords. The /PRESERVE_ASPECT keyword will maintain the aspect ratio of the image, keeping pixels square.
PXPERFECT - Get 'pixel perfect' Postscript output which matches the on-screen version PXPERFECT is designed to achieve nearly "pixel perfect" matching of plot layout when rendering a plot on the IDL Postscript device. The dimensions and character sizes of the current display device are used to construct a group of settings which can be passed to the Postscript device driver using the DEVICE procedure. The key capability of PXPERFECT is to determine the size of fonts to match the on-screen size. Once this size is determined, IDL will adjust other Postscript output dimensions such as plot margins, font sizes, symbol sizes, etc, to match exactly the on-screen layout. The current direct graphics device must be a screen display device, such as 'X' or 'WIN'. The user wouuld first call PXPERFECT() to determine what the appropriate settings for the Postscript device would be. At a later time, the user may switch to the Postscript device to render the plot for output. This is the approximate order of calling: ;; Prerequisite: current graphics device is display device SET_PLOT, 'X' ;; or 'WIN' TF = 1.0 ;; Thickness factor (see "Dealing with line thickness" below) ;; User adjusts the plot layout to taste PLOT, ... data ..., thick=1.0*TF ;; Capture layout settings and then initialize Postscript PS_EXTRA = PXPERFECT(THICK_FACTOR=TF) SET_PLOT, 'PS' ;; NOTE: PXPERFECT() called *before* SET_PLOT DEVICE, _EXTRA=PS_EXTRA ;; User calls same plot command(s) with no changes to layout PLOT, ... data ..., thick=1.0*TF ;; Close output plot file DEVICE, /CLOSE PXPERFECT also has settings to re-size the page and adjust Postscript line thicknesses.
PLOTCOLORFILL - Display colorful bar charts
PLOTCOLORFILL plots nice and optionally colorful bar charts. The example code in the documentation shows how to make stacked bar charts.
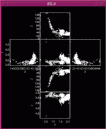
PLOTCUBE - Plot three dimensional data as a cube PLOTCUBE is a whimsical demonstration of PANELs -- an example of how to create a tight matrix of plots which can be printed and folded to make a three dimensional cube.
PLOTBIN - Plot fixed or variable-width histogram PLOTBIN plots histograms. The width of the histogram bins can be variable by using the WIDTH keyword.
| ||||||||||||||||||||||||||||||||||||||||||||
|
Copyright © 1997-2010 Craig B. Markwardt Last Modified on 2017-01-03 13:57:28 by Craig Markwardt |
 Screen shot
 Screen shot
 Screen shot